Operations Panel settings
As an administrator with the appropriate permissions—Connector Administration, System Administration, or the Client Admin role—you can configure which data is displayed and how it is presented. These settings apply system-wide and affect all users who access the Operations Panel.
To change the settings for Operations Panel, click General Settings in the top bar. When you are done, click Save. Changes take effect immediately.
For information about Threshold settings, see Change threshold settings for graphs.
General settings
Name | Description | |||||||||
|---|---|---|---|---|---|---|---|---|---|---|
Refresh time (minimal 15 sec) | Specifies how often the data shown in the operation panel is updated. | |||||||||
Value for Meter 1 | Select the value measured by Meter 1 in the Operations Panel:
| |||||||||
Value for Meter 2 | Select the value measured by Meter 2 in the Operations Panel:
Transaction time vs. Serving time
Table 15. Transaction time vs Serving time – When to use which?
| |||||||||
Value for Meter 3 | Select the value measured by Meter 3 in the Operations Panel:
| |||||||||
Use user's SLA settings | Check this box if you only want to change the SLA settings for your own Operations panel. If the box is checked, other users in your organization can access the Graph settings to make their own SLA settings. If the box is not checked, you change the SLA settings for all users in your organization. | |||||||||
Allow user to change SLA Settings | Check this box to allow all users to change the SLA settings (Graph Settings) for themselves. | |||||||||
View shown if only one branch present | Select what view to show when there is only one branch:-
| |||||||||
Default sorting order for branches | Options: Ascending or descending | |||||||||
Default sorting order for queues | Options: Ascending or descending | |||||||||
Default sorting order service points | Options: Ascending or descending | |||||||||
Show appointment summary | Check this box to show the Appointment Summary view. | |||||||||
Show Expressia graph | Check this box to show the Expressia graph. | |||||||||
Show NPS tab | Check this box to show the NPS tab. | |||||||||
Show webcam tab | Check this box to show the Webcam tab. | |||||||||
Height of the webcam frame | Set the height of the webcam frame in px. | |||||||||
Width of the webcam frame | Set the width of the webcam frame in % or px. | |||||||||
Show data if older than X min | Check this box to show data older than a specific time. If the box is not checked, data older than the set time will not be shown. | |||||||||
Time before data is invalid | Set the time for X in "Show data if older than X min". Data older than this will not be shown. | |||||||||
Time before status led becomes red | Set the limit for how much time (in minutes) must pass since the system was last updated before the light in the Status column in the Branch summary becomes red. | |||||||||
Show appointment waiting time | Check this box to show the appointment waiting time, i.e. the time between the current time and the appointment time. | |||||||||
Allow remove ticket | Check this box to allow removing tickets. | |||||||||
Allow transfer ticket to another queue | Check this box to enable ticket transfer actions. | |||||||||
Allow transfer to first position in queue | Check this box to enable the option Transfer to the front. | |||||||||
Allow transfer to last position in queue | Check this box to enable the option Transfer to the end. | |||||||||
Allow transfer based on sorting | Check this box to enable the option Transfer based on visit lifetime. | |||||||||
Allow transfer to closed service points | Check this box to enable transferring visits to closed service points. | |||||||||
Show customers serving in graph | Check this box to show the number of customers currently being served. | |||||||||
Enable tooltips on tables | Check this box to show tooltips | |||||||||
Number format | Use this setting to define how large numbers are displayed. You can choose from the following formats:
| |||||||||
Columns with SLA | Select which columns are to use SLA information:
| |||||||||
Show visit history in ticket list | Check this box to display a visit history icon ( Clicking the icon opens a detailed view showing all events associated with the visit/ticket, including visit creation, calls, transfers, and any other relevant actions. | |||||||||
Columns to be shown in ticket list | Select which columns are shown in the ticket list:
|

Branch summary settings
Name | Description |
|---|---|
Region view | Select how to show regions.
|
Root level of regions to show in region overview | Select the root level to show in the region overview. Selectable options are specified in Business configuration > Branch hierarchy. See Organize branches in branch groups (regions) |
Default sorting for branches | Set the default sorting column for the branch summary tab. |
Hide branches by id (example: 1,2,6-10) | Enter one or more branch IDs to hide them from view. You can specify individual IDs separated by commas (e.g., 1,2,5) or use hyphenated ranges to hide a sequence of IDs (e.g., 6–10). |
Hide inactive branches | Check this box to hide inactive branches in the branch summary. |
Include pool waiting on branch overview | Check this box to include pool waiting time in the branch overview. |
Show all tickets in a popup window | Check this box to allow users to click the queue icon to see all visits in a branch. |
Show history for today | Check this box to show the History column in the Branch Summary, where you access the daily history graph. |
Length of the daily history graph | Set the length (in minutes) of the daily history graph. |
Start time for daily history graph | Set the start time for the daily history graph. |
Service level for daily history graph | Set the service level for the daily history graph. |
Max value for daily history waiting time | Sets the maximum value for the waiting time in the daily history graph. |
Show totals | Check this box to show the totals for all columns. |
Show Branch Id | Check this box to show the Branch Id column. |
Show Waiting above service level | Check this box to show the current number of waiting customers above service level column. |
Show served above service level | Check this box to show the Served above service column |
Columns to be shown | Use this setting to customize which columns are displayed in the Branch summary view.
To modify the column layout:
|
Queue summary settings
Name | Description |
|---|---|
Default sorting for queues | Set the default sorting column for the queue summary tab |
Default sorting for tickets in queue | Select the sorting order for tickets in queue:
|
Group queues | Create and edit queue groups. |
Expand groups | Check this box to expand queue groups. If this box is not checked, you need to click on queue groups to see each queue that is in that group. |
Show graphs based on select Queue group | Check this box to make the graphs show data based on the queue group currently selected in the Queue summary. |
Show totals | Check this box to show the totals for all columns. |
Show Queue id | Check this box to show the Queue Id column. |
Show Waiting above service level | Check this box to show the current number of waiting customers above service level column. |
Show served above service level | Check this box to show served above service level column. |
Columns to be shown | Use this setting to customize which columns are displayed in the Queue summary view.
To modify the column layout:
|
Service Point summary settings
Name | Description |
|---|---|
Service Point Summary | Select whether or not to show the Service Point Summary:
|
Default sorting for service points | Select the default sorting order for service points:
|
Show service point id | Check this box to show the Service Point Id column. |
Show status icon | Check this box to show the status icon as a separate column. Green indicates that the service point is open. |
Show staff name in service point summary | Check this box to show which staff member is logged in at a service point. |
Served above service level | Check this box to show the number of served customers above service level. |
Show longest waiting time in pool | Check this box to show the customers with longest waiting time in pool. |
Show totals | Check this box to show the totals for all columns. |
Columns to be shown | Use this setting to customize which columns are displayed in the Service point summary view.
To modify the column layout:
|
Queue / Service Point summary settings
Name | Description |
|---|---|
Queue / Service Point Summary | Select whether or not to show the Queue / Service Point Summary:
|
Default sorting for queues | Set the default sorting column for the queue summary tab |
Show totals for queues | Check this box to display the total number of Waiting and Served customers at the bottom of the summary. |
Default sorting for service points | Select the default sorting order for service points:
|
Show status icon | Check this box to show the status icon as a separate column. Green indicates that the service point is open. |
Show totals for service points | Check this box to show the totals for all service points. |
Columns to be shown in Queue table | Use this setting to customize which columns are displayed in the Queue table. |
Columns to be shown in Service Point table | Use this setting to customize which columns are displayed in the Service point table. |
Backup settings
Use this tab to back up your current Operation panel settings, including layout, selected columns, and other display preferences. Creating a backup ensures that you can easily restore your preferred settings if, for example, a colleague makes changes.
Create queue groups (Operations Panel)
Go to General Settings > Queue, and check the box Group queues.
Save.
Go to General Settings > Queue Groups.
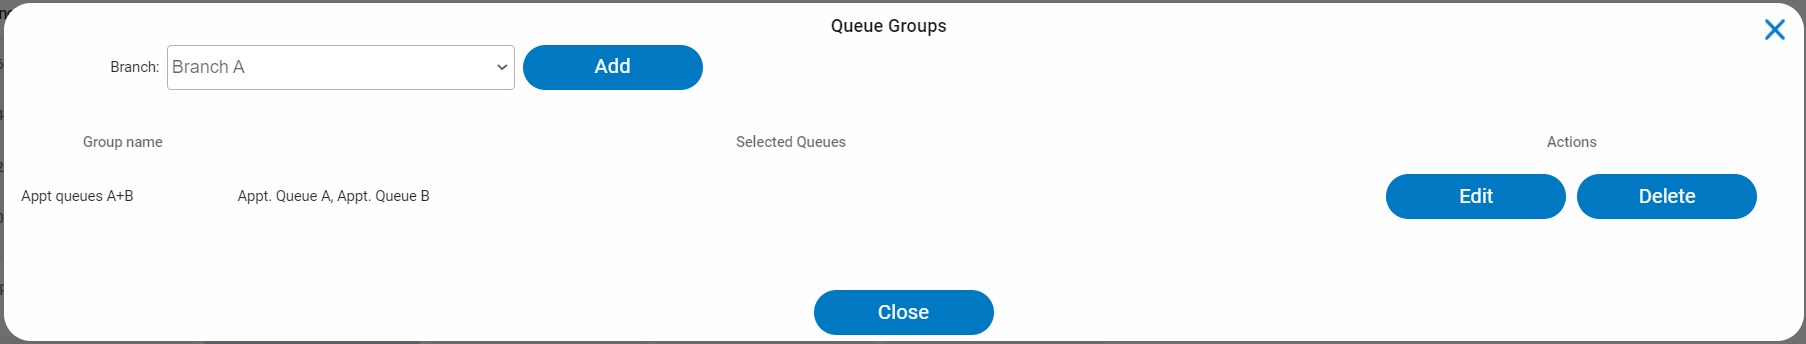
Select a branch.
Click Add.
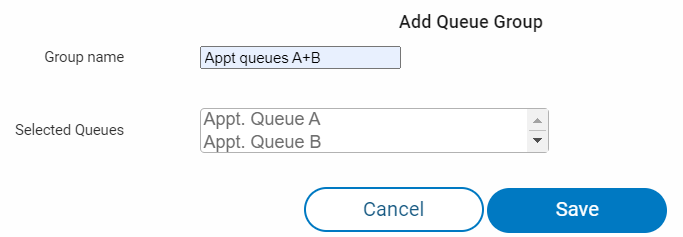
Enter a group name.
Select the queues you want to include in the group.
Save.
To edit a queue group
Go to General Settings > Queue Groups.
Click Edit next to the queue group you want to edit.
Change the group name and/or selected queues.
Save.
To delete a queue group
Go to General Settings > Queue Groups.
Click Delete next to the queue group you want to edit.